Dashboard
Blue Ocean’s "Dashboard" is the default view shown when you open Blue Ocean and shows an overview of all Pipeline projects configured on a Jenkins instance.
|
Blue Ocean status
Blue Ocean will not receive further functionality updates. Blue Ocean will continue to provide easy-to-use Pipeline visualization, but will not be enhanced further. It will only receive selective updates for significant security issues or functional defects. Alternative options for Pipeline visualization, such as the Pipeline: Stage View and Pipeline Graph View plugins, are available and offer some of the same functionality. While not complete replacements for Blue Ocean, contributions are encouraged from the community for continued development of these plugins. |
The Dashboard consists of a blue navigation bar at the top, the Pipelines list, as well as the Favorites list.
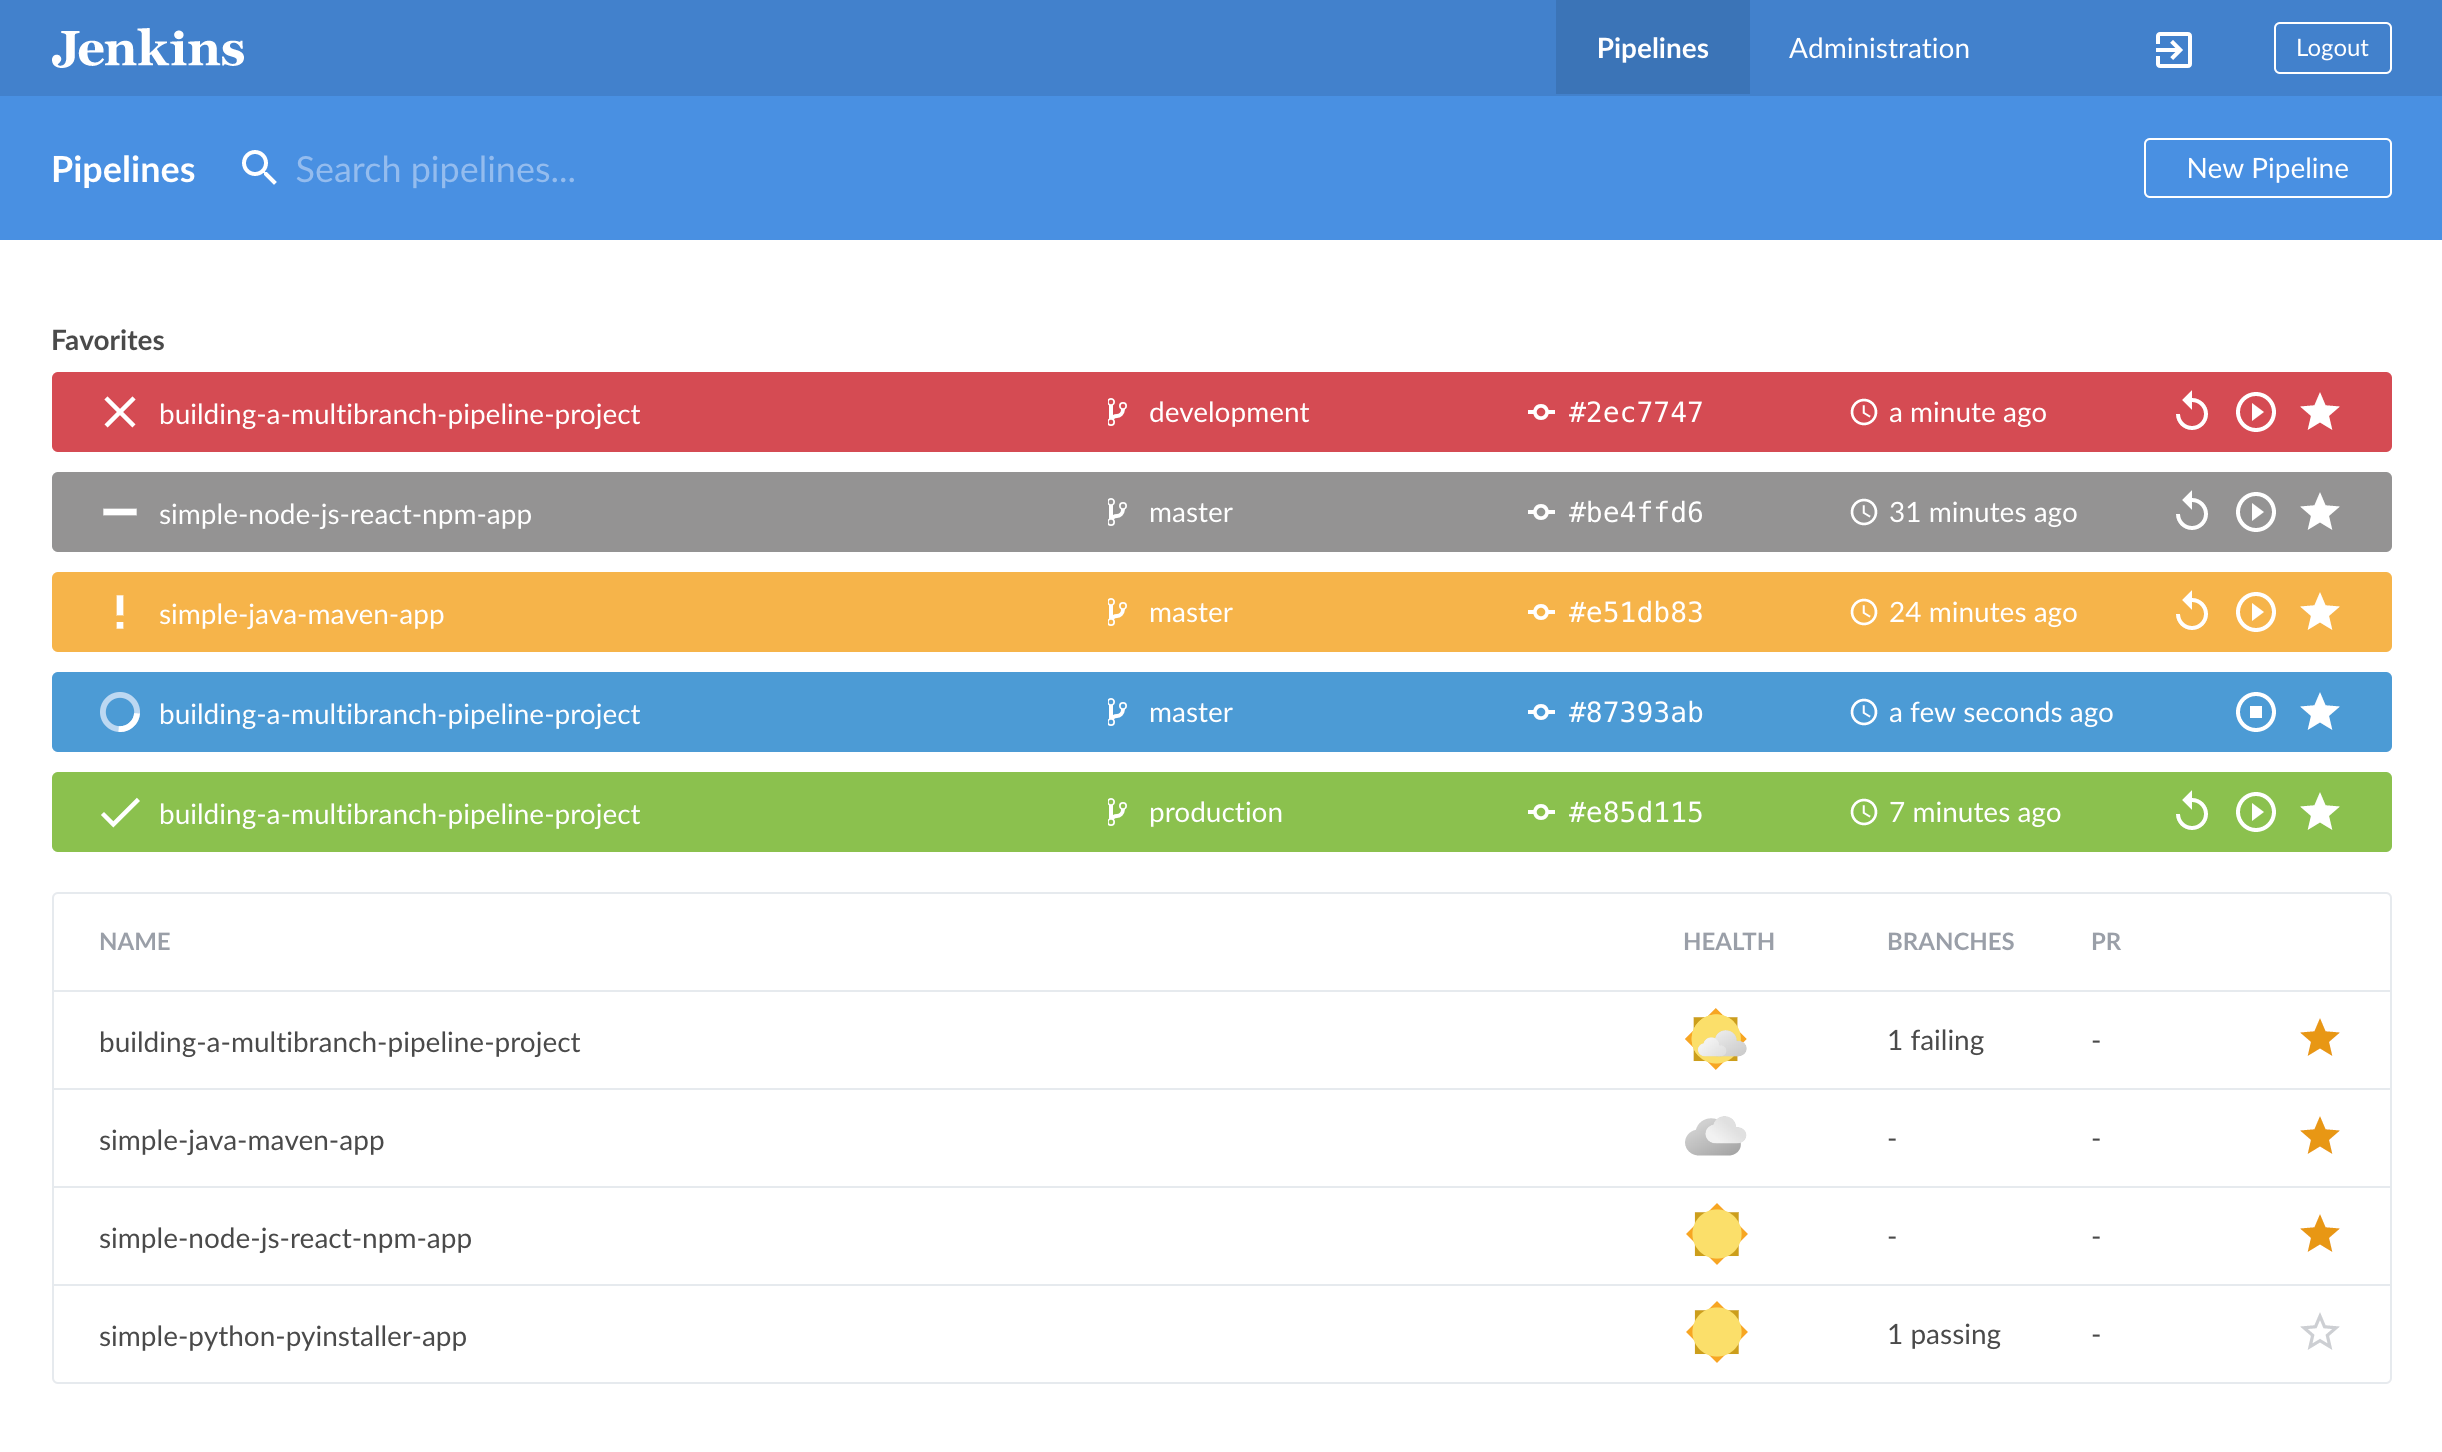
Navigation bar
The Dashboard includes the blue-colored navigation bar along the top of the interface.
This bar is divided into two sections - a common section along the top and a contextual section below. The contextual section changes depending on the current Blue Ocean page you are viewing.
When viewing the Dashboard, the navigation bar’s contextual section includes the:
-
Search pipelines field to filter the Pipelines list to show items containing the text you enter into this field.
-
New Pipeline button, which begins the create a Pipeline process.
Pipelines list
The "Pipelines" list is the Dashboard’s default list, and upon accessing Blue Ocean for the first time, this is the only list shown on the Dashboard.
This list shows the overall state of each Pipeline configured on the Jenkins instance (which can also include other Jenkins items). For a given item in this list, the following information is indicated:
-
The item’s NAME
-
The item’s HEALTH
-
The numbers of BRANCHes and pull requests (PRs) of the Pipeline’s source control repository which are passing or failing
-
A star, indicating whether or not the default/main branch of the item has been manually added to your current Jenkins user’s Favorites list.
Clicking on an item’s star will toggle between:
-
Adding the default branch of the item’s repository to your current user’s Favorites list (indicated by a solid "★"), and
-
Removing the item’s default branch from this list (indicated by an outlined "☆").
Clicking on an item in the Pipelines list will display that item’s Activity View.
Favorites list
The Favorites list appears above the Dashboard’s default Pipelines list when at least one Pipeline/item is present in your user’s Favorites list.
This list provides key information and actions for a core subset of your user’s accessible items in the Pipelines list. This key information includes the current run status for an item and its repository’s branch, as well as other details about the item’s run, including the name of the branch, the initial part of the commit hash, and the last run time. This list also includes clickable icons to run or re-run the item on the repository branch indicated.
You should only add an item (or one of the repository’s specific branches) to your Favorites list if you need to regularly examine that item’s branch. Adding an item’s specific branch to your Favorites list can be done through the item’s Activity View.
Blue Ocean automatically adds branches or PRs to this list when they contain a run that has changes authored by the current user.
You can also manually remove items from your Favorites list by clicking on the solid "★" in this list. When the last item is removed from this list, the list is removed from the interface.
Clicking on an item in the Favorites list will open the Pipeline run details for the latest run on the repository branch or PR indicated.
Health icons
Blue Ocean represents the overall health of a Pipeline/item or one of its repository’s branches using weather icons, which change depending on the number of recent builds that have passed.
Health icons on the Dashboard represent overall Pipeline health, whereas the health icons in the Branches tab of the Activity View represent the overall health for each branch.
| Icon | Health |
|---|---|
|
Sunny, more than 80% of Runs passing |
|
Partially Sunny, 61% to 80% of Runs passing |
|
Cloudy, 41% to 60% of Runs passing |
|
Raining, 21% to 40% of Runs passing |
|
Storm, less than 21% of Runs passing |


Please submit your feedback about this page through this quick form.
Alternatively, if you don't wish to complete the quick form, you can simply indicate if you found this page helpful?
See existing feedback here.